File:Time series plot of house price per unit area 1.png
From Thalesians Wiki
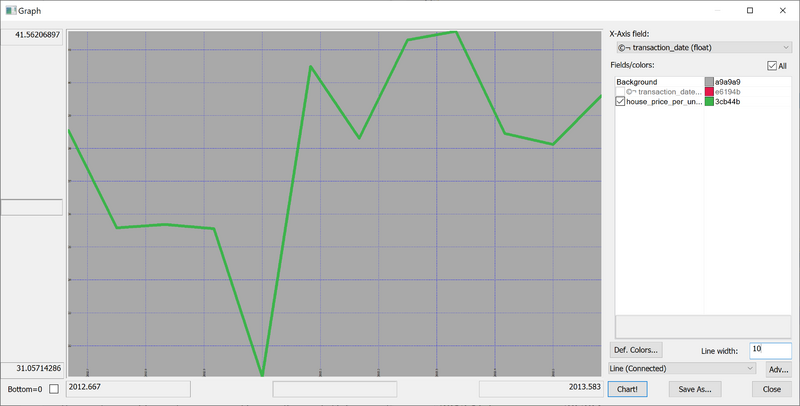
Size of this preview: 800 × 406 pixels. Other resolution: 2,847 × 1,446 pixels.
Original file (2,847 × 1,446 pixels, file size: 96 KB, MIME type: image/png)
Summary
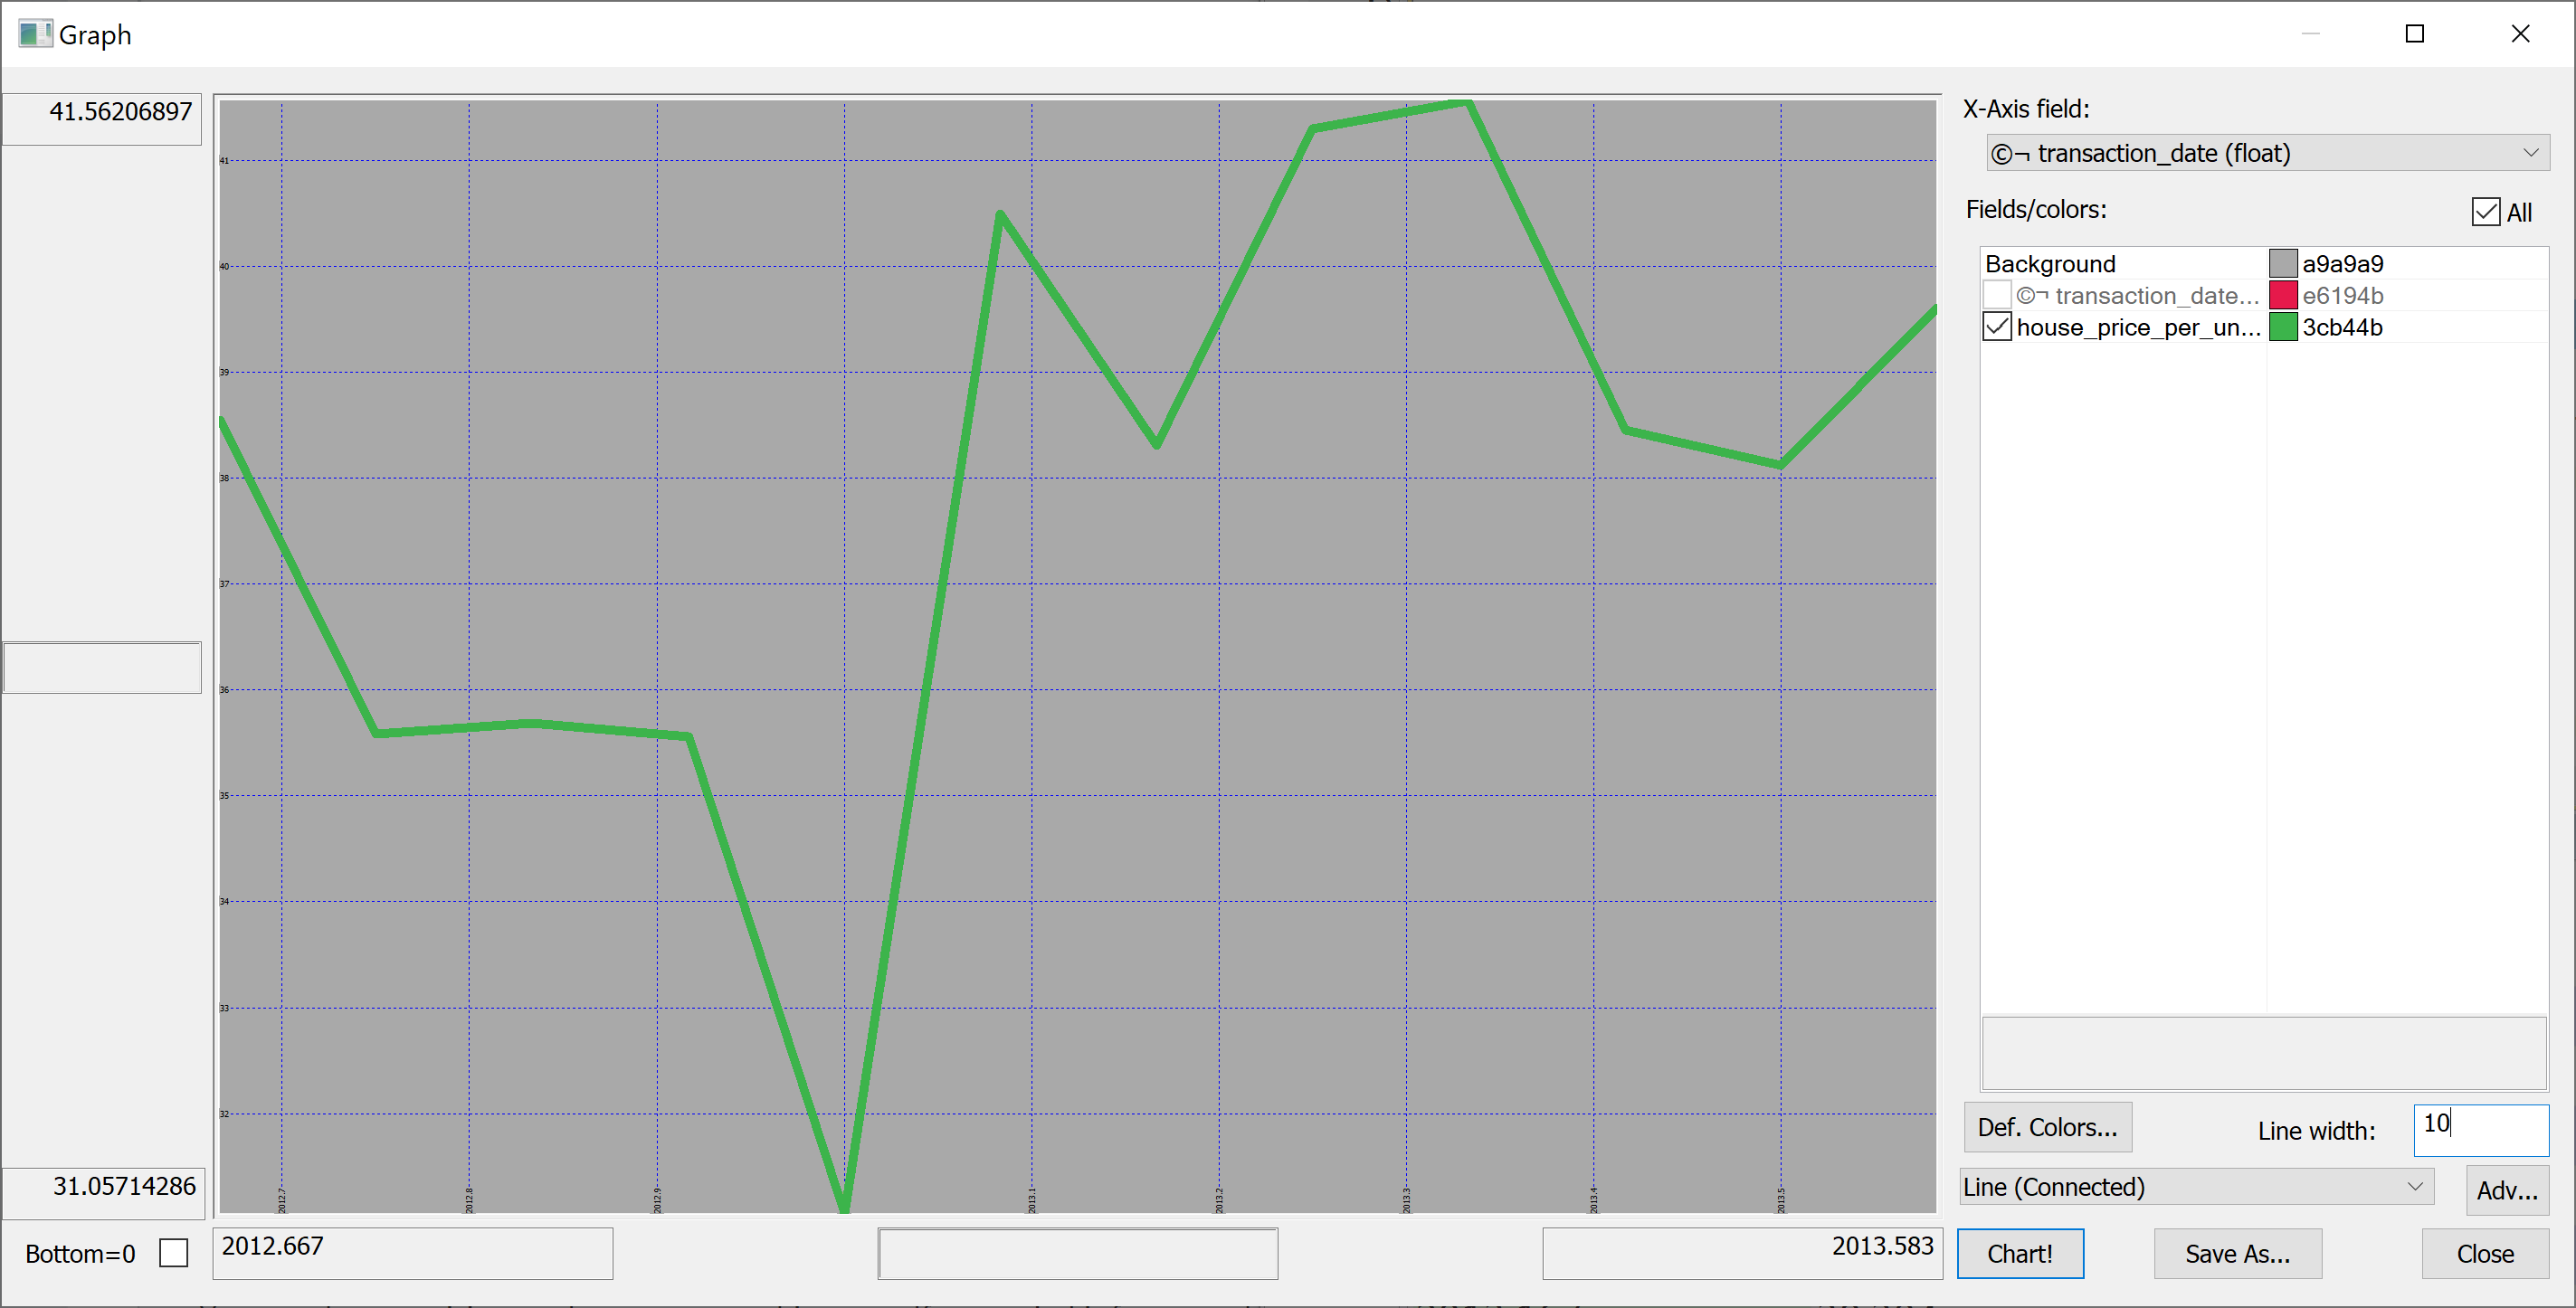
Time series plot of house_price_per_unit_area, mean values for each month.
File history
Click on a date/time to view the file as it appeared at that time.
| Date/Time | Thumbnail | Dimensions | User | Comment | |
|---|---|---|---|---|---|
| current | 09:53, 19 June 2021 | | 2,847 × 1,446 (96 KB) | Admin (talk | contribs) | Time series plot of <tt>house_price_per_unit_area</tt>, mean values for each month. |
You cannot overwrite this file.
File usage
The following page uses this file: