Difference between revisions of "File:Time series plot of house price per unit area.png"
From Thalesians Wiki
(Time series plot of house_price_per_unit_area) |
|||
| Line 1: | Line 1: | ||
== Summary == | == Summary == | ||
Time series plot of house_price_per_unit_area | Time series plot of <tt>house_price_per_unit_area</tt>. | ||
Latest revision as of 08:55, 19 June 2021
Summary
Time series plot of house_price_per_unit_area.
File history
Click on a date/time to view the file as it appeared at that time.
| Date/Time | Thumbnail | Dimensions | User | Comment | |
|---|---|---|---|---|---|
| current | 08:54, 19 June 2021 | 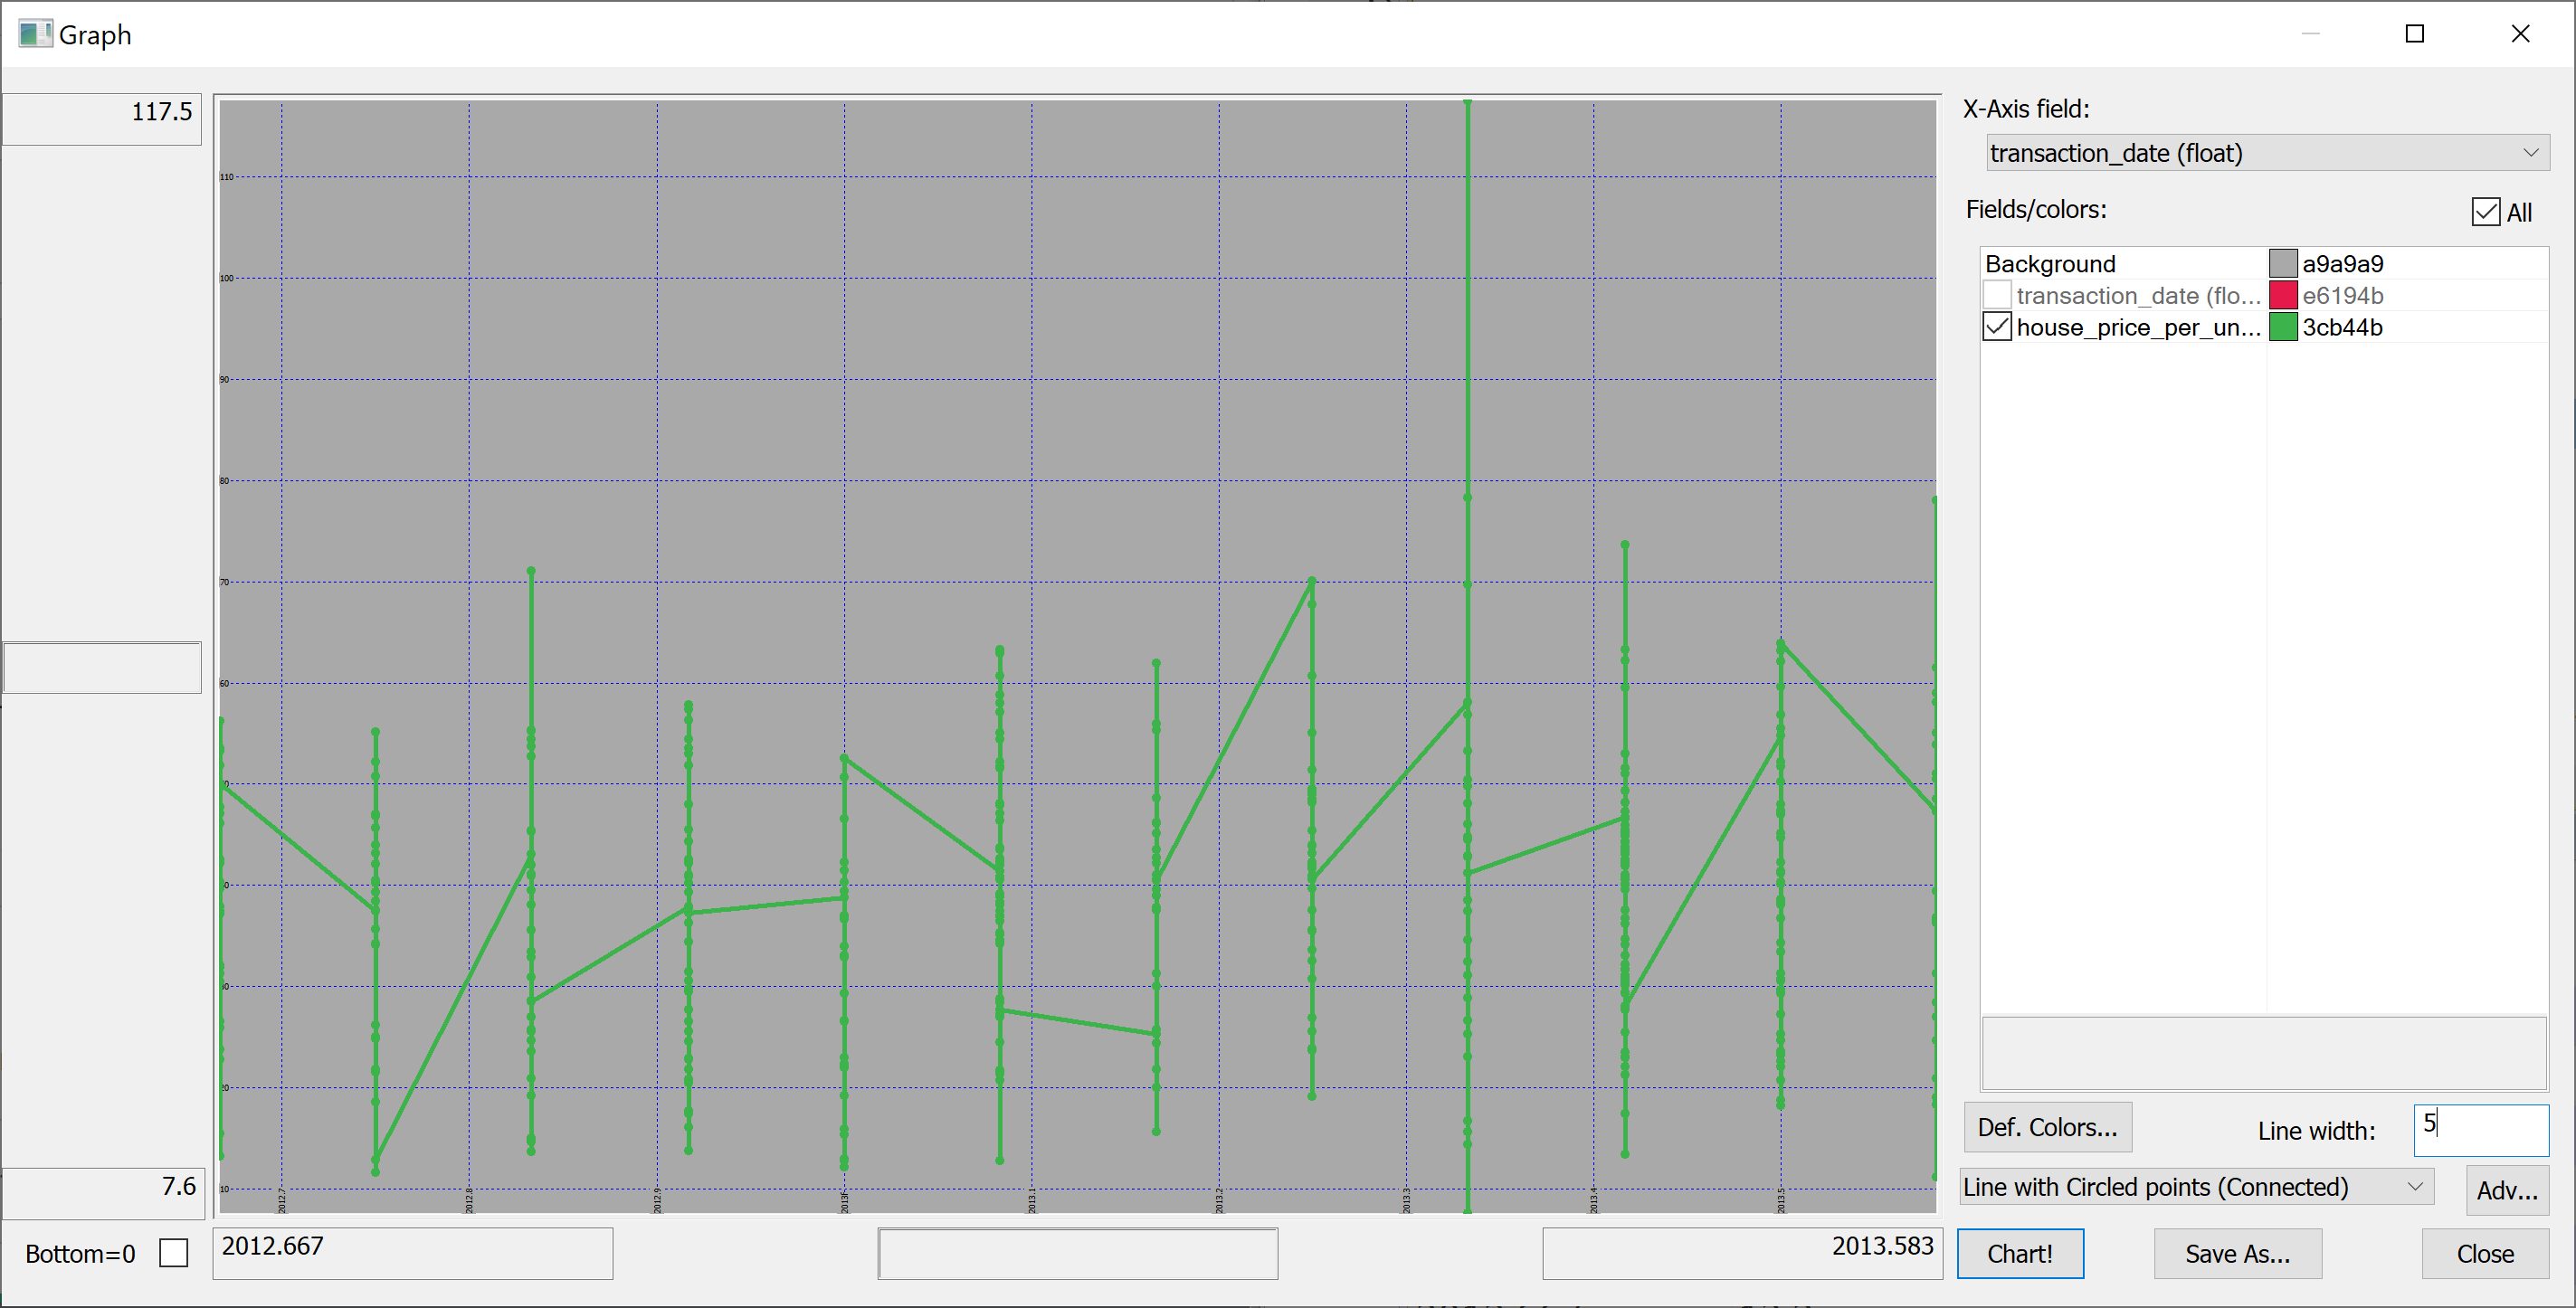 | 2,847 × 1,446 (109 KB) | Admin (talk | contribs) | Time series plot of house_price_per_unit_area |
You cannot overwrite this file.
File usage
The following page uses this file: